
In my previous post “Chrome Browser Exploitation, Part 1: Introduction to V8 and JavaScript Internals”, we took our first deep dive into the world of browser exploitation by covering a few complex topics that were necessary for fundamental knowledge. We mainly covered topics on how JavaScript and V8 worked under the hood by exploring what objects, maps and shapes were, how these objects were structured in memory, and we also covered some basic memory optimizations such as pointer tagging and pointer compression. We also touched on the compiler pipeline, bytecode interpreter, and code optimizations.
Now, if you haven’t read my previous post yet - then I highly recommend that you do so. Otherwise, you might be lost and totally unfamiliar with some of the topics presented within this post, since we are pretty much building off of the knowledge presented in Part 1 and further expanding on it.
In today’s blog post, we’ll go back to the compiler pipeline and will further expand on some of the concepts that we talked about, such as V8’s bytecode, code compilation, and code optimization. Overall, in this post we will be taking a deep dive into understanding what happens under the hood in Ignition, Sparkplug, and TurboFan as they are critical for our understanding in how certain “features” can lead to exploitable bugs.
The following topics will be discussed:
- Chrome Security Model
- Multi-Process Sandbox Architecture
- V8’s Isolate and Context
- Ignition Interpreter
- Understanding V8’s Bytecode
- Understanding the Register-Based Machine
- Sparkplug
- 1:1 Mapping
- TurboFan
- Just-In-Time Compilation (JIT)
- Speculative Optimization and Type Guards
- Feedback Lattice
- “Sea of Nodes” Intermediate Representation (IR)
- Common Optimizations
- Typer
- Range Analysis
- Bounds Checking Elimination (BCE)
- Redundancy Elimination
- Other Optimizations
- Control Optimization
- Alias Analysis & Global Value Numbering
- Dead Code Elimination (DCE)
- Common JIT Compiler Vulnerabilities
Alright, with that long and scary list of complex topics out of the way, let’s take a deep breath and dive right in!
Note: Most, if not all of the highlighted code paths are clickable links. Use these links to be taken to the relevant part of the Chromium source code so that you can examine the code more closely and follow along with the post.
Also, take the time to read through the code comments. The Chromium source code, while complex, has some pretty good comments that can help you in understanding what part of the code is and what it does.
Chrome Security Model
Before we dive into understanding the complexities of the compiler pipeline, how it does optimizations, and where bugs can appear, we first need to take a step back and look at the bigger picture. While the compiler pipeline plays a big role in JavaScript execution, it’s only one piece of the puzzle within the whole architecture of browsers.
As we’ve seen, V8 can run as a standalone application, but when it comes to the browser as a whole, V8 is actually embedded into Chrome and then utilized via bindings by another engine. Because of this, there are nuances and certain implications that we need to be aware of on how JavaScript code within an application is processed because that information is critical to our understanding of security issues within a browser.
For us to see this “bigger picture”, and to put together all the pieces of the puzzle, we need to start off by understanding the Chrome Security Model. This blog post series is a journey through browser internals and exploitation after all. So, to better understand why certain bugs are more trivial than others, and why exploitation of just one bug might not lead to direct remote code execution, we need to understand the architecture of Chromium.
As we know, JavaScript engines are an integral part to the execution of JavaScript code on systems. While they play a big role in making browsers fast and efficient, they also can open up a browser to crashes, application hang-ups, and even security risks. But JavaScript engines aren’t the only part of a browser that can have issues or vulnerabilities. Many other components such as the API’s or HTML and CSS render engines being used can also have stability issues and vulnerabilities that could potentially be exploited - albeit intentionally or not.
Now, it’s almost rather impossible to build a JavaScript or rendering engine that will never crash. And it’s also nearly impossible to build these types of engines to be safe and secure from bugs and vulnerabilities - especially because most of these components are programmed in the statically-typed language of C++ which needs to handle the dynamic nature of web applications.
So how does Chrome handle such an “impossible” task of trying to keep the browser running efficiently while also trying to keep the browser, system, and its users secure? In two ways, by using a multi-process architecture and sandboxing.
Multi-Process Sandbox Architecture
Chromium’s multi-process architecture is just that, an architecture that uses multiple processes to protect the browser from instability issues and bugs that can stem from the JavaScript engine, render engine, or other components. Chromium also restricts access between each of these processes by only allowing certain processes to talk to one another. This type of architecture can be viewed as the incorporation of memory protection and access controls within an application.
In general, browsers have one main process that runs the UI and manages all the other processes - this is known as the “browser process” or “browser” for short. Very unique, I know. The processes that handle the web content are known as the “renderer processes” or “renderers”. These render processes utilize something called Blink which is the open-source rendering engine used by Chrome. Blink implements many other libraries that help it run, such as Skia, which is an open-source 2D graphics library, and of course V8 for JavaScript.
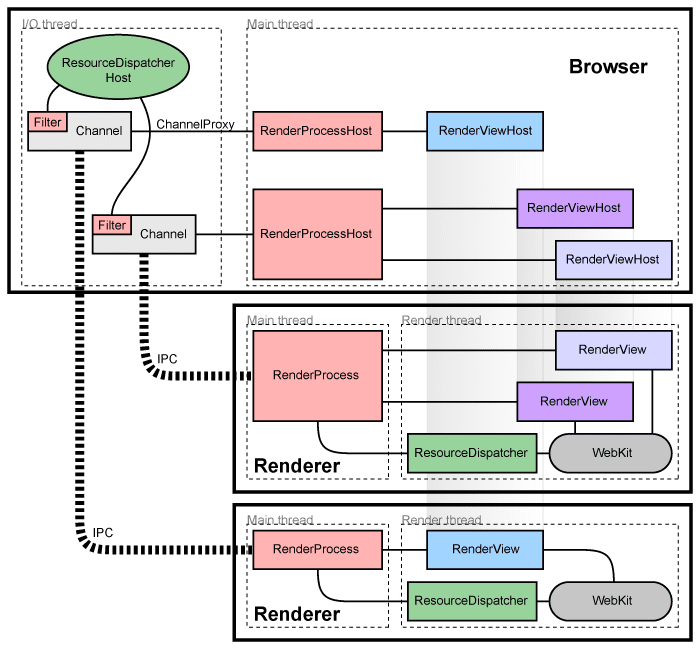
Now, here are where things get a little bit complicated. In Chrome, each new window or tab opens up in a new process - which usually will be a new render process. This new render process has a global RenderProcess object that manages communication with the parent browser process and maintains global state of the web page or application within that window or tab. In turn, the main browser process will maintain a corresponding RenderProcessHost object for each renderer, which manages browser state and communication for the renderer.
To communicate between each of these processes, Chromium uses either a legacy IPC system or Mojo. I’m not going to get into too much detail into how these work, because honestly the architecture and communication scheme of Chrome in and of itself can be a separate blog post. I will leave it up to the reader to follow the links and do your own research.
Overall, talk is cheap, and computational power is expensive. To help with better visualizing what we just explained, the image below from the Chromium development team will provide us with a high-level overview of what that multi-process architecture looks like.
In addition to each of these renderers being in its own process, Chrome also takes the opportunity to restrict the processes access to system resources via sandboxing. By sandboxing each process, Chrome can ensure that a renderers only access to network resources will be via the network service dispatcher running within the main process. Additionally, it can also restrict the processes access to the filesystem as well as access to the user’s display, cookies, and input.
In general, this limits what an attacker can do if they obtain remote code execution within a renderer process. Essentially, they won’t be able to make persistent changes to the computer or access information such as user input and cookies in other windows and tabs without exploiting or chaining another bug to break out of that sandbox.
I won’t go into any more detail from here as this will take away from the current topic of the blog post. But I highly suggest that you read the “Chromium Windows Sandbox Architecture” documentation in depth to not only understand the design principles, but to better understand the broker and target process communication scheme.
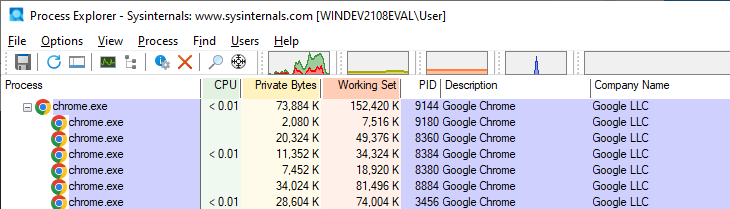
So how does this look like in practice? Well we can see a practical example of this by starting up Chrome, opening two tabs and launching Process Monitor. Initially we should see that Chrome has one parent or “browser” process and a few child processes, like so.
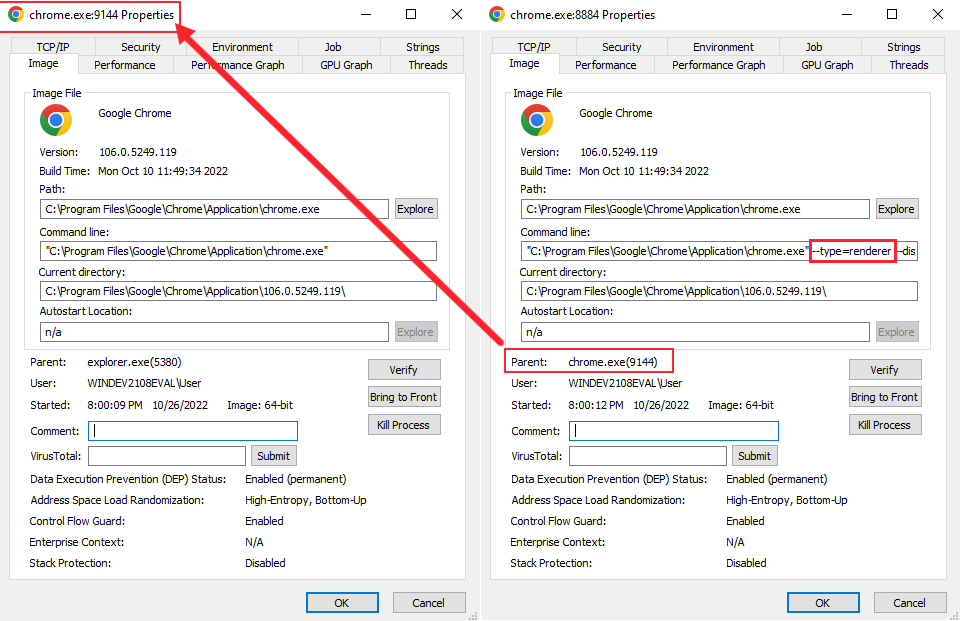
Now if we were to look into the main parent process, and compare it to a child process, we will notice that the other processes are running with different command line parameters. In the case of this example, we see that the child process (on the right) is that of the renderer type, and matches its parent browser process (on the left). Cool, right?
Alright, after covering all of this, I know that you might be asking me what does all of this have to do with V8 and JavaScript? Well, if you were paying attention, then you would have noticed a key point when I brought up Chromes renderer engine, Blink. And that’s the fact that it implements V8.
If you took the time to read up on some of the Blink documentation as a good student should, then you would have learned a little about Blink. Within the documentation it states that Blink runs in each renderer process and it has one main thread which handles JavaScript, DOM, CSS, style and layout calculations. Additionally, Blink can also create multiple “worker” threads to run additional scripts, extensions, etc.
In general, each Blink thread runs its own instance of V8. Why? Well as you know, within a separate browser window or tab there can be a lot of JavaScript code running, not just for the page, but in different iframes for stuff like ads, buttons, etc. At the end of the day each of those scripts and iframes have separate JavaScript contexts and there has to be a way of preventing one script from manipulating objects in another.
To help “isolate” one scripts context from another, V8 implements something known as an Isolate and Context, which we will now talk about.
V8’s Isolate and Context
In V8, an Isolate is simply a concept of an instance or “virtual machine” which represents one JavaScript execution environment; including a heap manager, a garbage collector, etc. In Blink, isolates and threads have a 1:1 relationship, where one isolate is associated with the main thread and one isolate is associated with one worker thread.
Now, the Context corresponds to a global root object which holds the state of the VM and is used to compile and execute scripts in a single instance of V8. Roughly speaking, one window object corresponds to one context, and since each frame has a window object, there are potentially multiple contexts in a renderer process. In relation to the isolate, the isolate and contexts have a 1:N relationship over the lifetime of the isolate - where that specific isolate or instance will interpret and compile multiple contexts.
This means that each time JavaScript need to be executed, we need to validate that we are in the correct context via GetCurrentContext() or we’ll end up either leaking JavaScript objects or overwriting them, which potentially can cause a security issue.
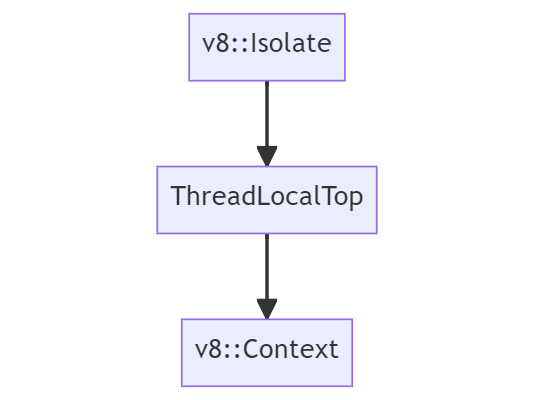
In Chrome, the runtime object v8::Isolate is implemented in v8/include/v8-isolate.h and the v8::Context object is implement in v8/include/v8-context.h. Using what we know, from a high-level, we can visualize the runtime and context inherence in Chrome to look like so:
If you would like to learn more about how these Isolates and Context work in depth, then I suggest reading “Design of V8 Bindings” and “Getting Started with Embedding V8”.
Ignition Interpreter
Now that we have a general overview of Chromium’s architecture, and understand that all JavaScript code isn’t executed in the same V8 engine instance, we can finally go back into the compiler pipeline and continue our deep dive.
We’ll start off by understanding V8’s interpreter, Ignition, in more depth.
As a recap from Part 1, let’s take a look back at our high-level overview of the V8 compilation pipeline just so we know where we are within this pipeline.

We already covered Tokens and Abstract Syntax Trees (AST) in Part 1, and we briefly explained how an AST is parsed and then translated into bytecode within the Interpreter. What I want to do now is cover V8’s bytecode, since the bytecode produced by the interpreter is a critical building block that makes up any JavaScript functionality. Additionally, when Ignition compiles bytecode, it also collects profiling and feedback data each time a JavaScript function is run. This feedback data is then used by TurboFan to generate JIT optimized machine code.
But, before we can begin to understand how the bytecode is structured, we need to first understand how Ignition implements it’s “register machine”. Reason being is that each bytecode specifies its inputs and outputs as register operands, so we sort of need to know where these inputs and outputs will go on the stack. This will also help us with further visualizing and understanding the stack frames that are produced in V8.
Understanding the Register-Based Machine
As we know, the Ignition interpreter is a register-based interpreter with an accumulator register. These “registers” aren’t actually traditional machine registers as one would think. Instead, they are specific slots in a register file which is allocated as part of a function’s stack frame - in essence they are “virtual” registers. As we’ll see later, bytecodes can specify these input and output registers on which their arguments will operate on.
Ignition consists of a set of bytecode handlers which are written in a high-level, machine agnostic assembly code. These handlers are implemented by the CodeStubAssembler class and compiled by using TurboFan’s backend when the browser is compiled. Overall, each of these handlers “handles” a specific bytecode and then dispatches to the next bytecode’s respective handler.
An example of the LdaZero or “Load Zero to Accumulator” bytecode handler from v8/src/interpreter/interpreter-generator.cc can be seen below.
// LdaZero
// Load literal '0' into the accumulator.
IGNITION_HANDLER(LdaZero, InterpreterAssembler)
{
  TNode<Number> zero_value = NumberConstant(0.0);
  SetAccumulator(zero_value);
  Dispatch();
}
When V8 creates a new isolate, it will load the handlers from a snapshot file that was created during build time. The isolate will also contain a global interpreter dispatch table which holds a code object pointer to each bytecode handler, as indexed by the bytecode value. Generally, this dispatch table is simply just an enum.
In order for the bytecode to be run by Ignition, the JavaScript function is first translated to bytecode from its AST by a BytecodeGenerator. This generator walks the AST and emits the appropriate bytecode per each AST node by calling the GenerateBytecode function.
This bytecode is then associated with the function (which is a JSFunction object) in a property field known as the SharedFunctionInfo object. Afterwards, the JavaScript functions code_entry_point is set to the InterpreterEntryTrampoline built-in stub.
The InterpreterEntryTrampoline stub is entered when a JavaScript function is called, and is responsible for setting up the appropriate interpreter stack frame while also dispatching to the interpreter’s bytecode handler for the first bytecode of the function. This then starts the execution or “interpretation” of the function by Ignition which is handled within the v8/src/builtins/x64/builtins-x64.cc source file.
Specifically, on Lines 1255 - 1387 within builtins-x64.cc the Builtins::Generate_InterpreterPushArgsThenCallImpl and Builtins::Generate_InterpreterPushArgsThenConstructImpl functions are responsible for further building out the interpreter stack frame by pushing the arguments and function state to the stack.
I won’t get too much more into the bytecode generator, but if you want to expand your knowledge, then I suggest reading the “Ignition Design Documentation: Bytecode Generation” section to get a better understanding of how it works under the hood. What I want to focus on in this section is the register allocation and stack frame creation for a function.
So how does this stack frame get generated?
Well, during bytecode generation, the BytecodeGenerator will also allocate registers in a function’s register file for local variables, context object pointers, and temporary values that are required for expression evaluation.
The InterpreterEntryTrampoline stub handles the initial building of the stack frame, and then allocates space in the stack frame for the register file. This stub will also write undefined to all the registers in this register file so that the Garbage Collector (GC) doesn’t see any invalid (i.e., non-tagged) pointers when it walks the stack.
Bytecode will operate on these registers by specifying it in its operands, and Ignition will then load or store data from the specific stack slot that is associated with the register. Since register indexes map directly to the function stack frame slots, Ignition can directly access other slots on the stack, such as the context and the arguments that were passed in with the function.
An example of how a stack frame for a function looks like (as provided by the Chromium team), can be seen below. Take note of the “Interpreter Stack Frame”. This is the stack frame that is built by the InterpreterEntryTrampoline.
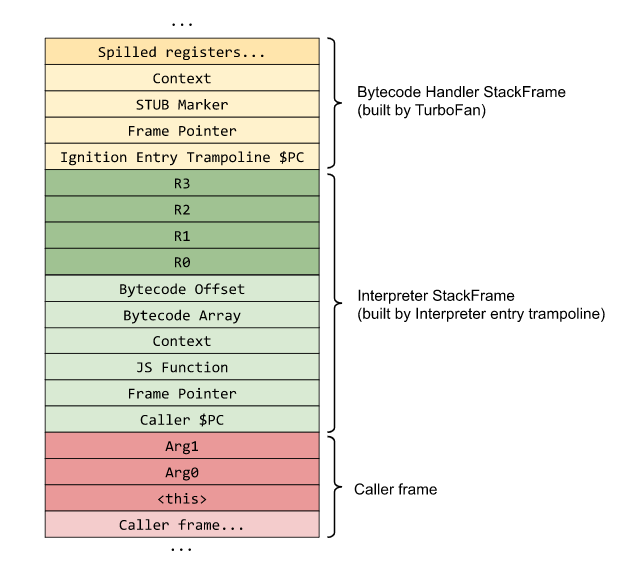
As you can see, we have the functions arguments in red, and it’s local variables and temporary variables for expression evaluation in green.
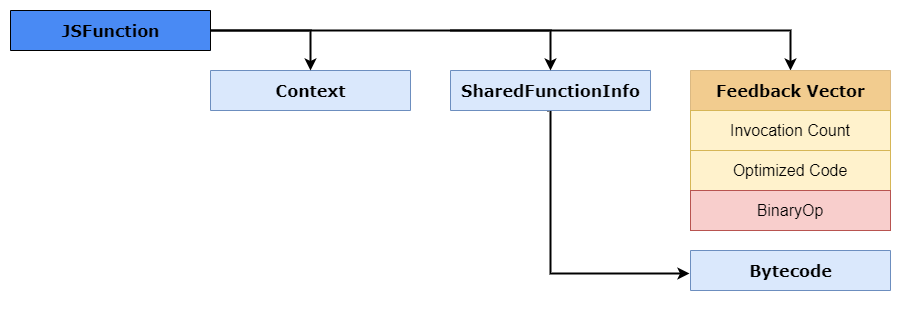
The light green portion contains the Isolates current context object, the caller pointer counter, and a pointer to the JSFunction object. This pointer to JSFunction is also knowns as the closure which links to the functions context, SharedFunctionInfo object, as well as to other accessors like the FeedbackVector. An example of how this JSFunction looks like in memory can be seen below.
You might also notice that there is no accumulator register in the stack frame. And the reason for that is because the accumulator register will change constantly during function calls, in that case it’s kept within the Interpreter as a state register. This state register is pointed to by the Frame Pointer (FP), which also holds the stack pointer and frame counter.
Going back to the first stack frame example, you will also notice that there is a Bytecode Array pointer. This BytecodeArray represents a sequence of interpreter bytecodes for that specific function within the stack frame. Initially each bytecode is an enum where the index of the bytecode stores the corresponding handler - as explained previously.
An example of this BytecodeArray can be seen in v8/src/objects/code.h and a snippet of that code is provided below.
// BytecodeArray represents a sequence of interpreter bytecodes.
class BytecodeArray
    : public TorqueGeneratedBytecodeArray<BytecodeArray, FixedArrayBase> {
 public:
  static constexpr int SizeFor(int length) {
    return OBJECT_POINTER_ALIGN(kHeaderSize + length);
  }

  inline byte get(int index) const;
  inline void set(int index, byte value);

  inline Address GetFirstBytecodeAddress();

  inline int32_t frame_size() const;
  inline void set_frame_size(int32_t frame_size);
As you can see, the GetFirstBytecodeAddress() function is responsible for getting the first bytecode address in the array. So how does it find that address?
Well let’s take a quick look at the bytecode generated for var num = 42.
d8> var num = 42;
[generated bytecode for function:  (0x03650025a599 <SharedFunctionInfo>)]
Bytecode length: 18
Parameter count 1
Register count 3
Frame size 24
Bytecode age: 0
         000003650025A61E @    0 : 13 00             LdaConstant [0]
         000003650025A620 @    2 : c4                Star1
         000003650025A621 @    3 : 19 fe f8          Mov <closure>, r2
         000003650025A624 @    6 : 66 5f 01 f9 02    CallRuntime [DeclareGlobals], r1-r2
         000003650025A629 @   11 : 0d 2a             LdaSmi [42]
         000003650025A62B @   13 : 23 01 00          StaGlobal [1], [0]
         000003650025A62E @   16 : 0e                LdaUndefined
         000003650025A62F @   17 : aa                Return
Don’t worry about what each of these bytecodes mean, we’ll explain that in a little. Take a look at the 1st line in the bytecode array, it stores LdaConstant. To the left of it we see 13 00. The hex number 0x13 is the bytecode enumerator, which represents where the handler for that bytecode will be.
Once that’s received, the SetBytecodeHandler() will be called with the bytecode, operands, and it’s handlers enum. This function is within the v8/src/interpreter/interpreter.cc file; an example of that function is shown below.
void Interpreter::SetBytecodeHandler(Bytecode bytecode,
                                     OperandScale operand_scale,
                                     CodeT handler) {
  DCHECK(handler.is_off_heap_trampoline());
  DCHECK(handler.kind() == CodeKind::BYTECODE_HANDLER);
  size_t index = GetDispatchTableIndex(bytecode, operand_scale);
  dispatch_table_[index] = handler.InstructionStart();
}

size_t Interpreter::GetDispatchTableIndex(Bytecode bytecode,
                                          OperandScale operand_scale) {
  static const size_t kEntriesPerOperandScale = 1u << kBitsPerByte;
  size_t index = static_cast<size_t>(bytecode);
  return index + BytecodeOperands::OperandScaleAsIndex(operand_scale) *
                     kEntriesPerOperandScale;
}
As you can see, dispatch_table_[index] will calculate the index of the bytecode from the dispatch table which is stored in a physical register, and eventually this will initiate or finalize the Dispatch() function to execute the bytecode.
The bytecode array also contains something called a “Constant Pool Pointer” which stores heap objects that are referenced as constants in generated bytecode, such as strings and integers. The constant pool is a FixedArray of pointers to heap objects. An example of this BytecodeArray pointer and its constant pool of heap objects can be seen below.

One more thing I want to mention before we continue, is that the InterpreterEntryTrampoline stub has some fixed machine registers that are used by Ignition. These registers are located within the v8/src/codegen/x64/register-x64.h file.
A sample of these registers can be seen below, and comments are added to the ones of interest.
// Define {RegisterName} methods for the register types.
DEFINE_REGISTER_NAMES(Register, GENERAL_REGISTERS)
DEFINE_REGISTER_NAMES(XMMRegister, DOUBLE_REGISTERS)
DEFINE_REGISTER_NAMES(YMMRegister, YMM_REGISTERS)

// Give alias names to registers for calling conventions.
constexpr Register kReturnRegister0 = rax;
constexpr Register kReturnRegister1 = rdx;
constexpr Register kReturnRegister2 = r8;
constexpr Register kJSFunctionRegister = rdi;
// Points to the current context object
constexpr Register kContextRegister = rsi;
constexpr Register kAllocateSizeRegister = rdx;
// Stores the implicit accumulator interpreter register
constexpr Register kInterpreterAccumulatorRegister = rax;
// The current offset of execution in the BytecodeArray
constexpr Register kInterpreterBytecodeOffsetRegister = r9;
// Points the the start of the BytecodeArray object which is being interpreted
constexpr Register kInterpreterBytecodeArrayRegister = r12;
// Points to the interpreter’s dispatch table, used to dispatch to the next bytecode handler
constexpr Register kInterpreterDispatchTableRegister = r15;
Now that we understand this, it’s time to dig into how V8 bytecode looks like and how the bytecode operand interacts with register file.
Understanding V8’s Bytecode
As stated in Part 1, there are several hundred bytecodes within V8, and they are all defined within the v8/src/interpreter/bytecodes.h header file. As we’ll see in a minute, each of these bytecodes specifies it’s input and output operands as registers to the register file. Additionally, many of the opcodes start with Lda or Sta, in the name, where the a stands for accumulator.
For example, let’s follow the bytecode definition for LdaSmi:
V(LdaSmi, ImplicitRegisterUse::kWriteAccumulator, OperandType::kImm)
As you can see the LdaSmi will “Load” (hence the Ld) a value into the accumulator register. In this case it will load a kImm operand which is a signed byte, which coincides with the Smi or Small Integer in they bytecode name. In summary, this bytecode will load a small integer into the accumulator register.
Do note, that a list of operands and their types are defined within the v8/src/interpreter/bytecode-operands.h header file.
So, with that basic information, let’s take a look at some bytecode of an actual JavaScript function. To start, let’s launch d8 with the --print-bytecode flag so we can see the bytecode. Once that’s done, just enter some random JavaScript code and press enter a few times. Reason for this is because V8 is a “lazy” engine, so it won’t compile stuff it doesn’t need. But because we are using strings, and numbers for the first time, it’s going to compile libraries like Stringify, which results in a massive amount of output at first.
Once done, let’s create a simple JavaScript function called incX which will increment an object’s property of x by one, and return it to us. The function should look like so.
function incX(obj) { return 1 + obj.x; }
This will generate some bytecode, but let’s not worry about it. Now that we have that, let’s call that function with an object that has a value assigned to property x, and view the bytecode generated.
d8> incX({x:13});
...
[generated bytecode for function: incX (0x026c0025ab65 <SharedFunctionInfo incX>)]
Bytecode length: 11
Parameter count 2
Register count 1
Frame size 8
Bytecode age: 0
         0000026C0025ACC6 @    0 : 0d 01             LdaSmi [1]
         0000026C0025ACC8 @    2 : c5                Star0
         0000026C0025ACC9 @    3 : 2d 03 00 01       GetNamedProperty a0, [0], [1]
         0000026C0025ACCD @    7 : 39 fa 00          Add r0, [0]
         0000026C0025ACD0 @   10 : aa                Return
Constant pool (size = 1)
0000026C0025AC99: [FixedArray] in OldSpace
 - map: 0x026c00002231 <Map(FIXED_ARRAY_TYPE)>
 - length: 1
           0: 0x026c000041ed <String[1]: #x>
Handler Table (size = 0)
Source Position Table (size = 0)
14
We’ll ignore most of the output and just focus on the bytecode section. But before we do, take note that this bytecode is in the SharedFunctionInfo object, which coincides with our explanation before! To start we see that LdaSmi is called to load a small integer into the accumulator register, which will be a value of 1.
Next, we call Star0 which will store (hence the st) the value in the accumulator (as per the a) in register r0. So in this case we move 1 to r0.
The GetNameProperty bytecode gets a named property from a0 and stores it in the accumulator, which will be the value of 13. The a0 refers to the i-th argument of the function. So if we passed in, a,b,x, and we wanted to load x, the bytecode operand would state a2 as we are the 2nd argument within the function (remember this is an array of arguments). In this case a0 will look up the named property in the table to where the index 0 maps to x.
 - length: 1
           0: 0x026c000041ed <String[1]: #x>
In short, this is the bytecode that loads obj.x. The other [0] operand is known as a feedback vector which contains runtime information and object shape data that is used for optimization by TurboFan.
Next, we Add the value in register r0 to the accumulator, resulting in the value of 14. Finally, we call Return which returns the value of the accumulator, and we exit the function.
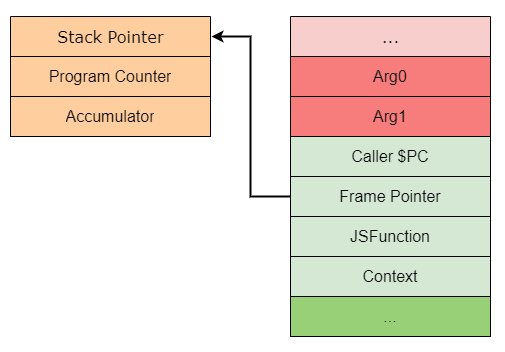
In order to help you visualize this on the stack frame, I have provided a GIF of what happens on a simplified stack with each bytecode instruction.
As you can see, while the bytecodes are a little cryptic, once we get the hang of what each one does, it’s pretty easy to understand and follow along. If you want to learn more about V8’s bytecode, I suggest reading “JavaScript Bytecode – v8 Ignition Instructions” which covers a good chunk of different operations.
Sparkplug
Now that we have a decent understanding of how Ignition generates and executes your JavaScript code as bytecode, it’s time we start looking into V8’s compilation portion of the compiler pipeline. We’ll start with Sparkplug because it’s rather easy to understand as it only does a small modification to the already generated bytecode and stack for optimization purposes.
As we know from Part 1, Sparkplug is V8’s very-fast non-optimizing compiler which sits in between Ignition and TurboFan. In essence, Sparkplug isn’t really a compiler but more of a transpiler which converts Ignitions bytecode into machine code to run it natively. Also, it’s a non-optimizing compiler, so it doesn’t do very specific optimizations since TurboFan will do that.
So, what makes Sparkplug so fast? Well, Sparkplug is fast because it cheats. The functions that it compiles have already been compiled down to bytecode, and as we know it, Ignition already has done the hard work of variable resolution, control flow, etc. In this case, Sparkplug compiles from the bytecode rather than from JavaScript source.
Second of all, Sparkplug doesn’t produce any intermediate representation (IR) like most compilers do (which we’ll learn about later). In this case, Sparkplug compiles directly to machine code in a single linear pass over the bytecode. This in general is known as 1:1 mapping.
The funny thing is that Sparkplug is pretty much just a switch statement inside a for loop which dispatches to fixed bytecode and then generates the machine code. We can see this implementation within the v8/src/baseline/baseline-compiler.cc source file.
An example of Sparkplug’s machine code generation function can be seen below.
switch (iterator().current_bytecode()) {
#define BYTECODE_CASE(name, ...)       \
  case interpreter::Bytecode::k##name: \
    Visit##name();                     \
    break;
    BYTECODE_LIST(BYTECODE_CASE)
#undef BYTECODE_CASE
  }
So how does Sparkplug generate this machine code? Well, it does so by cheating again, of course. Sparkplug generates very little code of its own, instead Sparkplug just calls the bytecode builtins that are usually entered by the InterpreterEntryTrampoline and then handled within v8/src/builtins/x64/builtins-x64.cc.
If you remember back to our JSFunction object during our talk about Ignition, you’ll remember that the closure linked to “optimized code”. In essence, Sparkplug will store the bytecode’s builtin there, and when the function gets executed, instead of dispatching to the bytecode, we call the builtin directly.
At this point you might be thinking that Sparkplug is essentially a glorified interpreter, and you wouldn’t be wrong. Sparkplug pretty much just serializes the interpreter’s execution by calling the same builtins. But this allows for the JavaScript function to be faster, because by doing this we can avoid the interpreter overheads like opcode decoding and bytecode dispatching lookups - allowing us to scale back CPU usage by moving from an emulation engine to native execution.
To learn a little bit more about how these builtins work, I suggest reading “Short Builtin Calls”.
1:1 Mapping
Sparkplug’s 1:1 mapping doesn’t just relate to how it compiles Ignition’s bytecode down to its machine code variant; it’s also related to stack frames as well. As we know, each portion of the compiler pipeline needs to store function state. And as we’ve seen already in V8, JavaScript function states are stored in Ignition’s stack frames by storing the current function being called, the context it is being called with, the number of arguments that were passed, a pointer to the bytecode array, and so on and so forth.
Now, as we know, Ignition is a register-based interpreter which has virtual registers that are used for function arguments and as inputs and outputs for bytecode operands. For Sparkplug to be fast and to avoid having to do any register allocation of its own, it reuses Ignitions register frames which in turn allows Sparkplug to mirror the interpreter’s behavior and stack as well. This allows Sparkplug to not need any sort of mapping between the two frames - making these stack frames almost 1:1 compatible.
Do note that I say “almost 1:1 compatible”, there is one small difference between the Ignition and Sparkplug stack frames. And that difference is that Sparkplug doesn’t need to keep the bytecode offset slot in the register file since Sparkplug code is emitted directly from the bytecode. Instead, it replaces it with the cached feedback vector.
An example of how these two stack frames compare can be seen in the image below - as provided by the Ignition Documentation.
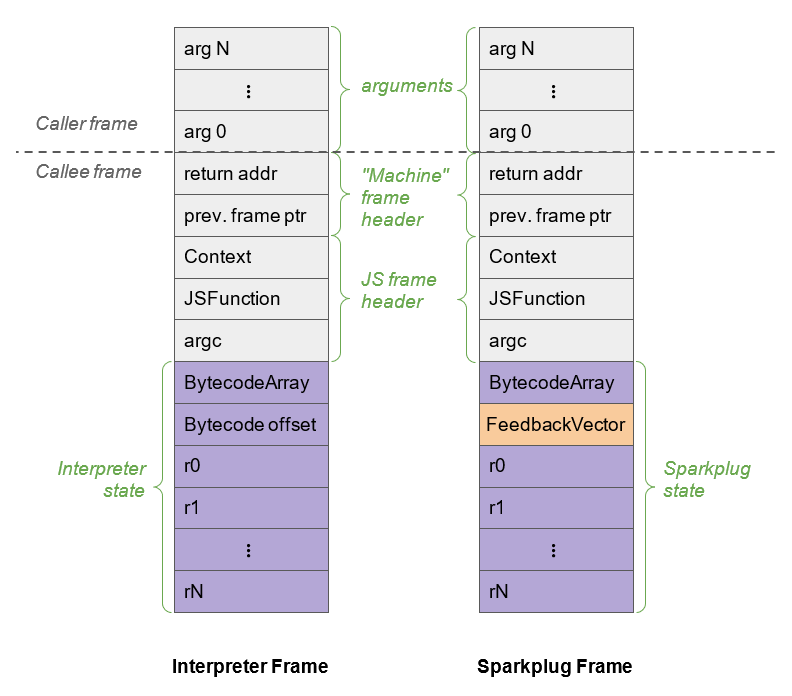
So why does Sparkplug need to creates and maintains a stack frame layout that’s similar to Ignitions? For one reason, and for the main reason of how Sparkplug and Turbofan work, by doing something called on-stack replacement (OSR). OSR is the ability to replace currently executing code with a different version. In this case, when Ignition sees that a JavaScript function is used a lot, it will send it to Sparkplug to speed it up.
Once Sparkplug serializes the bytecodes to their builtins, it will replace the Interpreters stack frame for that specific function. When the stack is walked and executed, the code will jump directly into Sparkplug instead of being executed on Ignitions emulated stack. And since the frames are “mirrored”, this technically allows V8 to swap between the interpreter and Sparkplug code with almost zero frame translation overhead.
Before we move on, I just want to point out the security aspect of Sparkplug. In general, there is unlikely to be a security issue in the generated code itself. The bigger security risk with Sparkplug is with how the layout of Ignitions stack frames are interpreted, which can lead to a type confusion or code execution on the stack.
One example of this would be Issue 1179595 which was a potential RCE due to an invalid register count check. There also is a concern in the way Sparkplug does RX/WX bit flipping - but I won’t go into detail as that’s really not important and such bugs don’t play an important role in this overall series.
Okay, so we understand how Ignition and Sparkplug works. Now, it’s time to dive deeper into the compiler pipeline and into understanding the optimizing compiler, TurboFan.
TurboFan
TurboFan is V8’s Just-In-Time (JIT) compiler that combines an interesting immediate representation concept known as the “Sea of Nodes” with a multi-layered translation and optimization pipeline that helps TurboFan generate better quality machine code from bytecode. To those who were paying attention by reading the code and documentation along the way, you’d know that TurboFan is much more than just a compiler.
TurboFan is actually responsible for the interpreter’s bytecode handlers, builtins, code stubs, and inline cache system via it’s macro assembler! So when I say that TurboFan is the most important part of the compiler pipeline, I wouldn’t be kidding.
So, how do these optimizing compilers, like TurboFan work?
Well optimizing compilers work via something called a “profiler” - which we briefly mentioned in Part 1. In essence, this profiler works ahead of time by watching for code that should be optimized (we refer to this code or JavaScript function as being “hot”). It does this by collecting metadata and “samples” from JavaScript functions and the stack by looking at the information collected by inline caches and the feedback vector.
The compiler then builds an intermediate representation (IR) data structure which is used to produce optimized code. This whole process of watching the code and then compiling machine code is called Just-in-Time or JIT compilation.
Just-In-Time Compilation (JIT)
As we know, the execution of bytecode in the interpreter VM is slower than assembly execution on the native machine. Reason for this is because JavaScript is dynamic and there is a lot of overhead for property lookups, checking of objects, values, etc. and we’re also running on an emulated stack.
Of course, Maps and Incline Caching (IC) help solve some of these overheads by speeding up dynamic lookup of properties, objects, and values - but they still can’t deliver peak performance. The reason for that is because each IC acts on its own, and it has no knowledge or concept about its neighbors.
Take Maps for example, if we add a property to a known shape, we still have to follow the transitions table and look up or add additional shapes. If we have to do this many times over and over again for a specific function or object, even with a known shape, we’re pretty much wasting computational cycles by doing this time and time again.
So, when there is a JavaScript function that is executed a lot of times, it might be worth spending the time to pass the function into the compiler and compile it down to machine code, allowing it to be executed much faster.
For example, let’s take this code:
function hot_function(obj) {
	return obj.x;
}

for (let i=0; i < 10000; i++) {
	hot_function({x:i});
}
The hot_function simply takes in an object and returns the value of property x. Next, we execute that function approximately 10k times and for each object we just pass a new integer for property x. In this case, because the function is used a lot of times and the general shape of the object doesn’t change, V8 might decide that it’s better to just pass it up the pipeline (known as a “tier-up”) for compilation so that it’s executed faster.
We can see this in actions within d8 by tracing the optimization with the --trace-opt flag. So, let’s do just that, and also, tack on the --allow-natives-syntax command so we can explore how the functions code looks like before and after optimization.
We’ll start by launching d8 and then setting up our function. Afterwards, use the %DisassembleFunction against hot_function to see its type. You should get something similar.
d8> function hot_function(obj) {return obj.x;}
d8> %DisassembleFunction(hot_function)
0000027B0020B31D: [CodeDataContainer] in OldSpace
 - map: 0x027b00002a71 <Map[32](CODE_DATA_CONTAINER_TYPE)>
 - kind: BUILTIN
 - builtin: InterpreterEntryTrampoline
 - is_off_heap_trampoline: 1
 - code: 0
 - code_entry_point: 00007FFCFF5875C0
 - kind_specific_flags: 0
As you can see, initially this code object will be executed by Ignition since it’s a BUILTIN and will be handled by the InterpreterEntryTrampoline as we know. Now, if we execute this function 10k times, we will see it be optimized by TurboFan.
d8> for (let i=0; i < 10000; i++) {hot_function({x:i});}
[marking 0x027b0025aa4d <JSFunction (sfi = 0000027B0025A979)> for optimization to TURBOFAN, ConcurrencyMode::kConcurrent, reason: small function]
[compiling method 0x027b0025aa4d <JSFunction (sfi = 0000027B0025A979)> (target TURBOFAN) OSR, mode: ConcurrencyMode::kConcurrent]
[completed compiling 0x027b0025aa4d <JSFunction (sfi = 0000027B0025A979)> (target TURBOFAN) OSR - took 1.691, 81.595, 2.983 ms]
[completed optimizing 0x027b0025aa4d <JSFunction (sfi = 0000027B0025A979)> (target TURBOFAN) OSR]
9999
As you can see, TurboFan kicks in and starts compiling the function for optimization. Take note of a few key points in the optimization trace. As you can see in line one of the opt trace, we are marking the JSFunction’s SFI or SharedFunctionInfo for optimization.
If you remember back to our Ignition deep dive, you’ll remember that the SFI contains the bytecode for our function. TurboFan will use that bytecode to generate IR and then optimize it down to machine code.
Now, if you look further down, you’ll see a mention of OSR or on-stack replacement. Pretty much TurboFan does the same thing Sparkplug does when it optimizes bytecode. It will replace the stack frame with a real JIT or system stack frame that will point to the optimized code during runtime. This allows the function to go directly to the optimized code the next time it is called, versus being executed within Ignitions emulated stack.
If we run %DisassembleFunction against our hot_function again, we should see that it is now optimized and the code entry point in the SharedFunctionInfo will point to optimized machine code.
d8> %DisassembleFunction(hot_function)
0000027B0025B2B5: [CodeDataContainer] in OldSpace
 - map: 0x027b00002a71 <Map[32](CODE_DATA_CONTAINER_TYPE)>
 - kind: TURBOFAN
 - is_off_heap_trampoline: 0
 - code: 0x7ffce0004241 <Code TURBOFAN>
 - code_entry_point: 00007FFCE0004280
 - kind_specific_flags: 4
To those with a keen eye, you might have noticed something interesting when we traced the optimization of our function. If you paid close attention, you would have noticed that TurboFan didn’t kick in right away, but after a few seconds - or after a few thousand iterations of the loop. Why is that?
The reason this happens is because TurboFan waits for the code to “warm up”. If you remember back to our discussion about Ignition and Sparkplug, we briefly mentioned the feedback vector. This vector stores the object runtime data along with information from the inline caches and collects what is known as type feedback.
This is critical for TurboFan because as we know, JavaScript is dynamic and there is no way for us to store static type information. Second of all, we don’t know the type of a value till runtime. The JIT compiler actually has to make educated guesses about the usage and behavior of the code it’s compiling, such as what your function type is, the type of variables that are being passed in, etc. In essence the compiler makes a lot of assumptions or “speculations”.
This is why optimizing compilers look at the information collected by incline caches and use the feedback vector to help make informed decisions on what it needs to do with the code to make it fast. This is known as Speculative Optimization.
Speculative Optimization and Type Guards
So how does speculative optimization help us turn our JavaScript code into highly optimized machine code? Well to help explain that, let’s start with an example.
Let’s say we have a simple evaluation for a function called add, such as return 1 + i. Here we are returning a value by adding 1 to i. Without knowing what type i is, we need to follow the ECMAScript standard implementation for the runtime semantic of EvaluateStringOrNumericBinaryExpression.
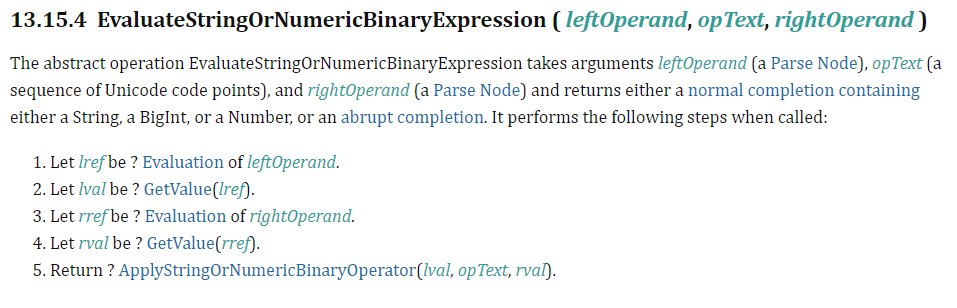
As you can see, once we evaluate the left and right references, and call GetValue on both the left and right values of our operand, we then need to follow the ECMAScript standard to ApplyStringOrNumericBinaryOperator so we can return our value.
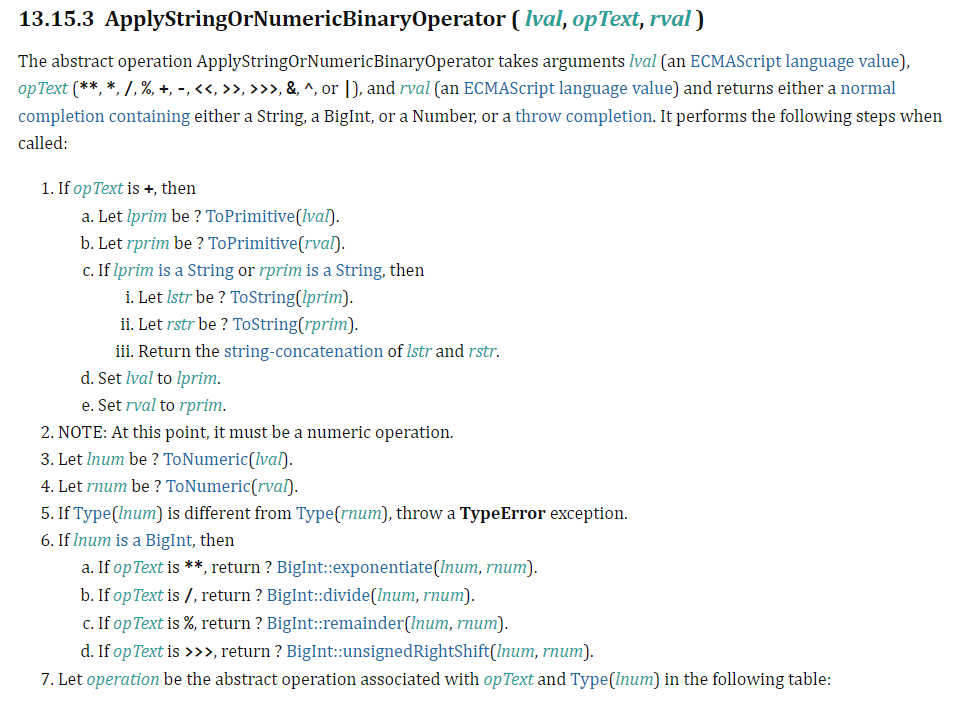
If it’s not already obvious to you, without knowing the type of variable i is, be it an integer or string, there is no way we can implement this whole evaluation in just a few machine instructions, and nonetheless have it be fast.
This is where the speculative optimization comes in, where TurboFan will rely on the feedback vector to make its assumptions about the possible types that i is.
For example, if after a few hundred runs we look at the feedback vector for the Add bytecode, and know that i is a number, then we don’t have to handle the ToString or even the ToPrimitive evaluations. In that case, the optimizer can take an IR instruction and claim that i and the return value are just numbers and load it as such. Which minimizes the amount of machine instructions we need to generate.
So how do these feedback vectors look like in the case of our function?
Well, If you remember back to the mention of the JSFunction object or closure, you’ll remember that the closure linked us to the feedback vector slot as well as the SharedFunctionInfo. Within the feedback vector, there is an interesting slot called the BinaryOp slot, which records feedback about the inputs and outputs of binary operations such as +, -, *, etc.
We can check what’s inside our feedback vector and see this specific slot by running %DebugPrint against our add function. Your output should be similar to mines.
d8> function add(i) {return 1 + i;}
d8> for (let i=0; i<100; i++) {add(i);}
d8> %DebugPrint(add)
DebugPrint: 0000019A002596F1: [Function] in OldSpace
 - map: 0x019a00243fa1 <Map[32](HOLEY_ELEMENTS)> [FastProperties]
 - prototype: 0x019a00243ec9 <JSFunction (sfi = 0000019A0020AA45)>
 - elements: 0x019a00002259 <FixedArray[0]> [HOLEY_ELEMENTS]
 - function prototype:
 - initial_map:
 - shared_info: 0x019a0025962d <SharedFunctionInfo add>
 - name: 0x019a00005809 <String[3]: #add>
 - builtin: InterpreterEntryTrampoline
 - formal_parameter_count: 1
 - kind: NormalFunction
 - context: 0x019a00243881 <NativeContext[273]>
 - code: 0x019a0020b31d <CodeDataContainer BUILTIN InterpreterEntryTrampoline>
 - interpreted
 - bytecode: 0x019a0025a89d <BytecodeArray[9]>
 - source code: (i) {return 1 + i;}
 - properties: 0x019a00002259 <FixedArray[0]>
   ...
 - feedback vector: 0000019A0025B759: [FeedbackVector] in OldSpace
 - map: 0x019a0000273d <Map(FEEDBACK_VECTOR_TYPE)>
 - length: 1
 - shared function info: 0x019a0025962d <SharedFunctionInfo add>
 - no optimized code
 - tiering state: TieringState::kNone
 - maybe has maglev code: 0
 - maybe has turbofan code: 0
 - invocation count: 97
 - profiler ticks: 0
 - closure feedback cell array: 0000019A00003511: [ClosureFeedbackCellArray] in ReadOnlySpace
 - map: 0x019a00002981 <Map(CLOSURE_FEEDBACK_CELL_ARRAY_TYPE)>
 - length: 0

 - slot #0 BinaryOp BinaryOp:SignedSmall {
     [0]: 1
  }
   ...
There are a few interesting items in here. Invocation count shows us the number of times we ran the add function, and if we look into our feedback vector, you’ll see that we have exactly one slot, which is the BinaryOp that we talked about. Looking into that slot we see that it contains the current feedback type of SignedSmall which in essence refers to an SMI.
Remember, this feedback information is not interpreted by V8 but by TurboFan, and as we know, an SMI is a signed 32bit value as we explained during the pointer tagging portion in Part 1 of this series.
Overall, these speculations via feedback vectors are great in helping speed up our code by removing unnecessary machine instructions for different types. Unfortunately, it’s pretty unsafe to just apply instructions solely focused around one type to dynamic objects.
So, what happens if halfway during the optimized function we pass in a string instead of a number? In essence, if this was to happen then we would have a type confusion vulnerability on our hands. To protect against potentially wrong assumptions, TurboFan prepends something known as a type guard before execution of specific instructions.
This type guard checks to make sure that the shape of the object we are passing in is the correct type. This is done before the object reaches our optimized operations. If the object does not match the expected shape, then the execution of the optimized code can’t continue. In that case, we will “bail out” of the assembly code, and jump back to the unoptimized bytecode within the interpreter and continue execution there. This is known as “deoptimization”.
An example of a type guard and jump to deoptimization in the optimized assembly code can be seen below.
REX.W movq rcx,[rbp-0x38]       ; Move i to rcx
testb rcx,0x1                   ; Check if rcx is an SMI
jnz 00007FFB0000422A  <+0x1ea>  ; If check fails, bailout
Now deoptimizations due to type guards aren’t just limited in checking if there is a mismatch in object types. They also work on arithmetic operations and bound checking.
For example, if our optimized code was optimized for arithmetic operations on 32bit integers, and there is an overflow, we can deoptimize and let Ignition handle the calculations - thus protecting us from potential security issues on the machine. Such issues that can lead to deoptimization are known as “side-effects” (which we’ll cover in more detail later).
As with the optimization process, we can also see deoptimization in action within d8 by utilizing the --trace-deopt flag. Once done, let’s re-add our add function and run the following loop.
for (let i=0; i<10000; i++) {
	if (i<7000) {
		add(i);
	} else {
		add("string");
	}
}
This simply will let the function be optimized for numbers, and then after 7k iterations, we’ll start passing in a string - which should trigger a bail out. Your output should be similar to mines.
d8> function add(i) {return 1 + i;}
d8> for (let i=0; i<10000; i++) {if (i<7000) {add(i);} else {add("string");}}
[marking 0x03e20025ac55 <JSFunction (sfi = 000003E20025AB5D)> for optimization to TURBOFAN, ConcurrencyMode::kConcurrent, reason: small function]
[compiling method 0x03e20025ac55 <JSFunction (sfi = 000003E20025AB5D)> (target TURBOFAN) OSR, mode: ConcurrencyMode::kConcurrent]
[completed compiling 0x03e20025ac55 <JSFunction (sfi = 000003E20025AB5D)> (target TURBOFAN) OSR - took 1.987, 70.704, 2.731 ms]
[completed optimizing 0x03e20025ac55 <JSFunction (sfi = 000003E20025AB5D)> (target TURBOFAN) OSR]
[bailout (kind: deopt-eager, reason: Insufficient type feedback for call): begin. deoptimizing 0x03e20025ac55 <JSFunction (sfi = 000003E20025AB5D)>, 0x7ffb00004001 <Code TURBOFAN>, opt id 0, node id 63, bytecode offset 40, deopt exit 3, FP to SP delta 96, caller SP 0x00ea459fe250, pc 0x7ffb00004274]
[compiling method 0x03e20025ac55 <JSFunction (sfi = 000003E20025AB5D)> (target TURBOFAN) OSR, mode: ConcurrencyMode::kConcurrent]
[completed compiling 0x03e20025ac55 <JSFunction (sfi = 000003E20025AB5D)> (target TURBOFAN) OSR - took 0.325, 121.591, 1.425 ms]
[completed optimizing 0x03e20025ac55 <JSFunction (sfi = 000003E20025AB5D)> (target TURBOFAN) OSR]
"1string"
As you can see, the functions gets optimized, and later we trigger a bailout. This deoptimizes the code back to bytecode due to an insufficient type during our call. Then, something interesting happens. The function gets optimized again. Why?
Well, the function is still “hot” and there are a few more thousand iterations to go. What TurboFan will do, now that it collected both a number and string within the type feedback, is that it will go back and optimize the code for a second time. But this time it will add code which will allow for string evaluation. In this case, a second type guard will be added - so the second run of code is now optimized for both a number and a string!
A good example and explanation of this can be seen in the video “Inside V8: The choreography of Ignition and TurboFan”.
We can also see this updated feedback in the BinaryOp slot by running the %DebugPrint command against our add function. You should see something similar as below.
d8> %DebugPrint(add)
DebugPrint: 000003E20025970D: [Function] in OldSpace
 - map: 0x03e200243fa1 <Map[32](HOLEY_ELEMENTS)> [FastProperties]
 - prototype: 0x03e200243ec9 <JSFunction (sfi = 000003E20020AA45)>
 - elements: 0x03e200002259 <FixedArray[0]> [HOLEY_ELEMENTS]
 - function prototype:
 - initial_map:
 - shared_info: 0x03e20025962d <SharedFunctionInfo add>
 - name: 0x03e200005809 <String[3]: #add>
 - builtin: InterpreterEntryTrampoline
 - formal_parameter_count: 1
 - kind: NormalFunction
 - context: 0x03e200243881 <NativeContext[273]>
 - code: 0x03e20020b31d <CodeDataContainer BUILTIN InterpreterEntryTrampoline>
 - interpreted
 - bytecode: 0x03e20025aca5 <BytecodeArray[9]>
 - source code: (i) {return 1 + i;}
 - properties: 0x03e200002259 <FixedArray[0]>
   ...
 - feedback vector: 000003E20025ACF1: [FeedbackVector] in OldSpace
 - map: 0x03e20000273d <Map(FEEDBACK_VECTOR_TYPE)>
 - length: 1
 - shared function info: 0x03e20025962d <SharedFunctionInfo add>
 - no optimized code
 - tiering state: TieringState::kNone
 - maybe has maglev code: 0
 - maybe has turbofan code: 0
 - invocation count: 5623
 - profiler ticks: 0
 - closure feedback cell array: 000003E200003511: [ClosureFeedbackCellArray] in ReadOnlySpace
 - map: 0x03e200002981 <Map(CLOSURE_FEEDBACK_CELL_ARRAY_TYPE)>
 - length: 0

 - slot #0 BinaryOp BinaryOp:Any {
     [0]: 127
  }
As you can see, the BinaryOp now stores the feedback type of Any, instead of SignedSmall and String. Why? Well, this is due to something called the Feedback Lattice.
Feedback Lattice
The feedback lattice stores the possible feedback states for an operation. It starts with None, which indicates that it hasn’t seen anything and it goes down toward the Any state, which indicates that it’s seen a combination of inputs and outputs. The Any state indicates that the function is to be considered polymorphic, while in contrast, any other state indicates that the function is monomorphic - since it’s only produced a certain value.
If you would like to learn more about the difference between monomorphic and polymorphic code, I highly suggest you read the fantastic article “What’s up with Monomorphism?”.
Below, I have provided you a visual example of what the feedback lattice roughly looks like.

Just like the array lattice from Part 1, this lattice works the same way. Feedback can only progress downwards in the lattice. Once we go from Number to Any, we can never go back. If we do go back for some magic reason, then we risk entering a so-called deoptimization loop where the optimizing compiler consumes invalid feedback and bails out from optimized code continuously.
You can see more information on the type checks within the v8/src/compiler/use-info.h file. Also, if you want to learn more about V8’s feedback system and inline cache, I suggest watching “V8 and How It Listens to You - Michael Stanton”.
“Sea of Nodes” Intermediate Representation (IR)
Now that we know how type feedback is collected for TurboFan to make its speculative assumptions, let’s see how TurboFan builds its specialized IR from this feedback. The reason that IR is generated is due to the fact that this data structure abstracts from code complexity, which in turn makes it easier to preform compiler optimizations.
Now, TurboFans “Sea of Nodes” IR is based on static single assignment or SSA, which is a property of IR that requires each variable to be assigned exactly once and defined before it is used. This is useful for optimizations such as redundancy elimination.
An example of SSA for our add function from our previous example can be seen below.
// function add(i) {return 1 + i;}
var i1 = argument
var r1 = 1 + i1
return r1
This SSA form is then converted to a graph format, which is similar to a control-flow graph (CFG) where it uses nodes and edges to represent code and its dependencies between computations. This type of graph form allows TurboFan to utilize it for both data-flow analysis and machine code generation.
So, let’s see how this Sea of Nodes looks like. We’ll use our hot_function example for this. Start by creating a new JavaScript file and add the following to it.
function hot_function(obj) {
	return obj.x;
}

for (let i=0; i < 10000; i++) {
	hot_function({x:i});
}
Once done, we will run this script via d8 with the --trace-turbo flag which allows us to trace and save the IR generated by TurboFans JIT. Your output should look similar to mines. At the end of the run, it should generate a JSON file that has the naming convention of turbo-*.json.
C:\dev\v8\v8\out\x64.debug>d8 --trace-turbo hot_function.js
Concurrent recompilation has been disabled for tracing.
---------------------------------------------------
Begin compiling method add using TurboFan
---------------------------------------------------
Finished compiling method add using TurboFan
After that’s completed, navigate to Turbolizer in a web browser, press CTRL + L and load your JSON file. This tool will help us visualize the sea of nodes graph generated by TurboFan.
The graph you see should pretty much be identical to mines.
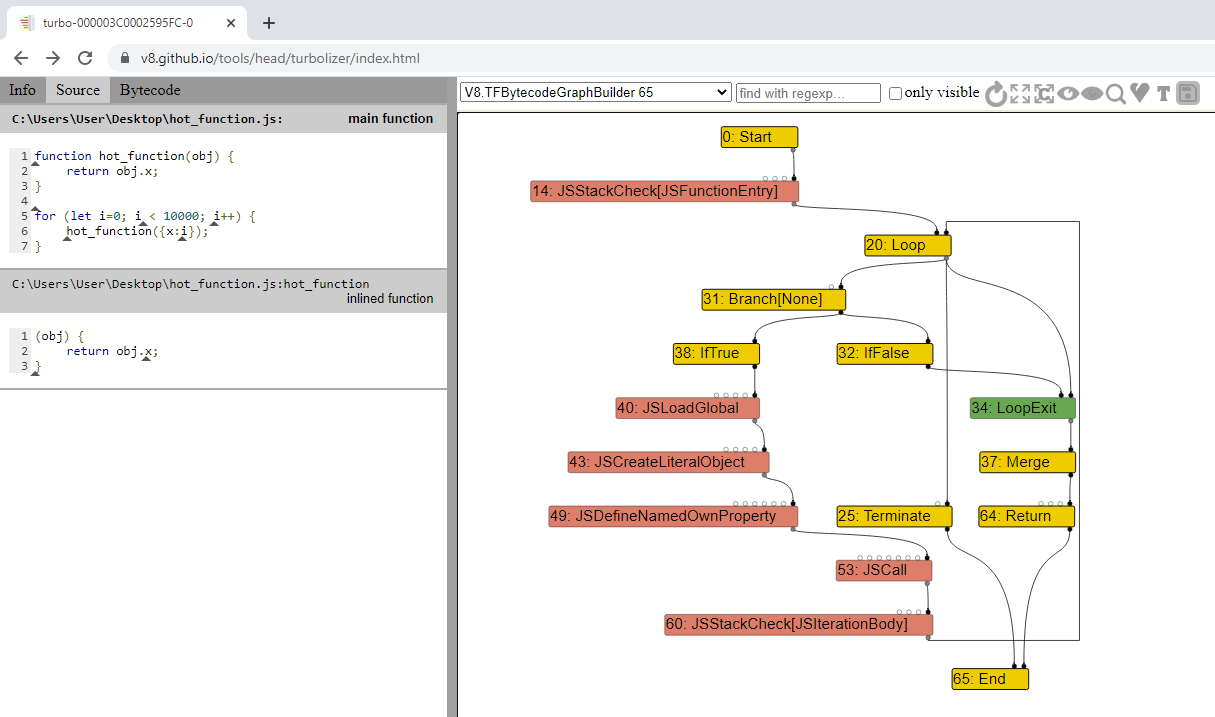
In Turbolizer, on the left you’ll see your source code, and the right side (not shown in image) you’ll have the optimized machine code that was generated by TurboFan. In the middle you will have the sea of nodes graph.
Currently there are a lot of the nodes hidden and only the control nodes are shown, which is the default behavior. If you click on the “Show All Nodes” box to the right of the “refresh” symbol, you’ll see all the nodes.
By messing around in Turbolizer and viewing the graph you’ll notice that there are five different colors of nodes and they represent the following:
- Yellow: These nodes represent control nodes, meaning anything that can change the “flow” of the script - such as an if/else statement.
- Light Blue: These nodes represent a value a certain node can have or return, such as heap constants or inlined values.
- Red: Represents semantics of JavaScript’s overloaded operators, such as any action that is executed at the JavaScript level, i.e.,
JSCall,JSAdd, etc. These resemble bytecode operations. - Blue: Express VM-level operations, such as allocations, bound checks, loading data off stack, etc. This is helpful in tracking feedback being consumed by Turbofan.
- Green: These correspond to single machine level instructions.
As we can see, each node within this Sea of Nodes can represent arithmetic operations, loads, stores, calls, constants, etc. Then there are three edges (represented by the arrows between each node) that we need to know about which express dependencies. These edges are:
- Control: Just like in a CFG, these edges enable branches and loops.
- Value: Just like in Data Flow Graphs, these show value dependencies and output.
- Effect: Detail order operations such as reading or writing states.
With that knowledge, let’s expand the graph a little bit and look at a few of the other nodes to understand how the flow works. Take note that I have hidden a few select nodes that aren’t really important.
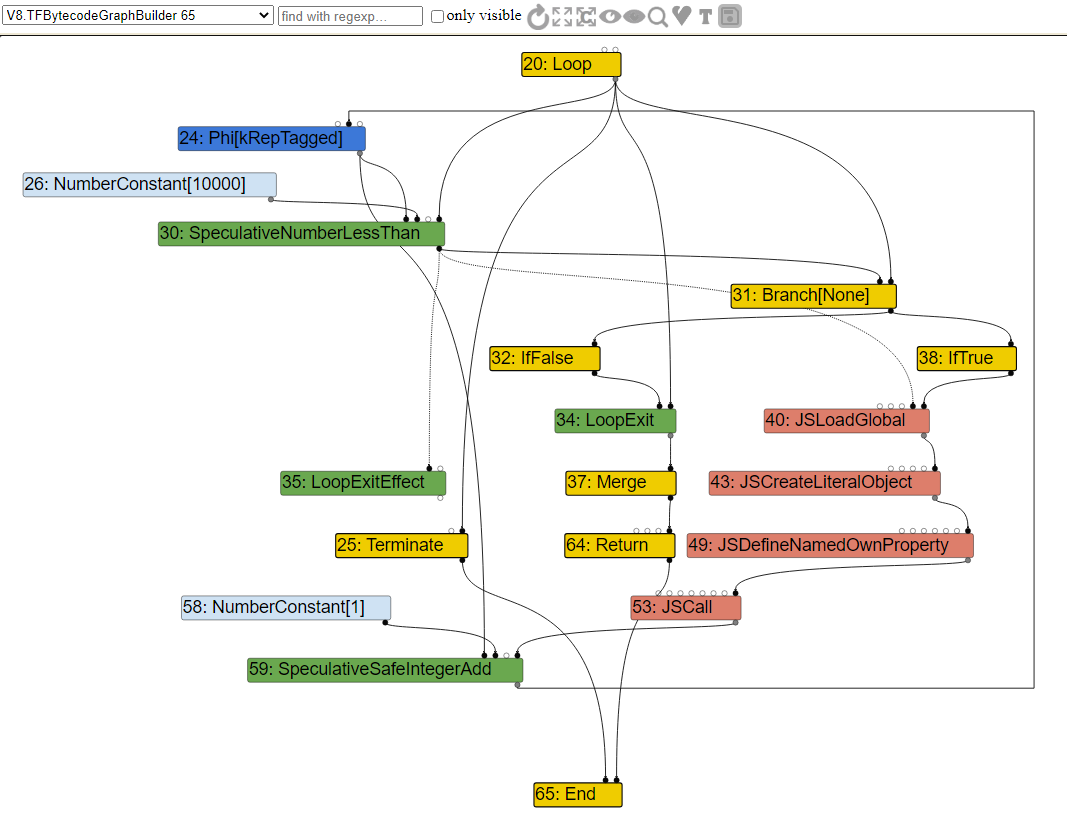
As we can see, the Yellow colored nodes are control nodes which manage the flow of the function. Initially we have the Loop node which tells us that we are going into a loop. From there the control edges points to the Branch and LoopExit nodes. The Branch is exactly what it means, it “branches” the loop into a True/False statement.
If we follow the Branch node up, we will see that it has a SpeculativeNumberLessThan node which has a value edge pointing to a NumberConstant with the value of 10000. This falls in line with our function, since we were looping 10k times. Since this node is Green, it is a machine instruction, and signifies our type guard for the loop.
You can see from the SpeculativeNumberLessThan node that there is an effect edge pointing to LoopExitEffect, which means that if the number is more then 10k, we exit the loop, because we just broke the assumption.
While the value is under 10k and the SpeculativeNumberLessThan is true, we will load our object, and call JSDefineNamedOwnProperty which will get the objects offset to property x. Then we call JSCall to add 1 to our property value and return the value. From that node we also have an effect edge going to SpeculativeSafeIntegerAdd. This node has a value edge pointing to a NumberConstant node that has the value of 1, which is the mathematical addition we are doing when we return the value.
Again note that we have a SpeculativeSafeIntegerAdd node that checks to make sure that the addition arithmetic we are doing is indeed adding an SMI and not something else, otherwise it would trigger the type guard and deoptimize.
For those that might be wondering what the Phi node is, that’s basically an SSA node that merges the two (or more) possibilities for a value that have been computed by different branches. In this case it’s merging both of the potential integer speculations together.
As you can see, understanding these graphs isn’t too complex once you understand the basics.
Now, if you look at the top left portion of the sea of nodes window, you’ll see that we are in the V8.TFBytecodeGraphBuilder option. This option shows us the generated IR from bytecode without any optimizations applied to it. From the drop-down menu we can select the other different optimization passes that this code goes through to view the associated IR.
Common Optimizations
Alright, now that we covered TurboFans Sea of Nodes, we should have at least a decent understanding of how to navigate and understand the generated IR. From here we can dive into understanding some of TurboFans common optimizations. These optimizations in essence act on the original graph that was produce from bytecode.
Since the resulting graph now has static type information due to type guards, the optimizations are done in a more classic ahead-of-time fashion to improve the execution speed or memory footprint of the code. Afterwards, once the graph is optimized, the resulting graph is lowered to machine code (known as “lowering”) and is then written into an executable memory region for V8 to execute when the compiled function is called.
One thing to note, is that lowering can happen in multiple stages with further optimizations in between, making this compiler pipeline pretty flexible.
With that being said, let’s look into a few of these common optimizations.
Typer
One of the earliest optimization phases is called the TyperPhase which is ran by the OptimizeGraph function. This phase traces through the code and identifies the resulting types of operations from heap objects, such as Int32 + Int32 = Int32.
When Typer runs it will visit every node of the graph and will try to “reduce” them down by trying to simplify operation logic. It will then call the node’s associated typer call to associate a Type with it.
For example, in our case the constant integers within the loop and return arithmetic will be visited by Typer::Visitor::TypeNumberConstant, which will return a type of Range - as can be seen by the code example from v8/src/compiler/types.cc.
Type Type::Constant(double value, Zone* zone) {
  if (RangeType::IsInteger(value)) {
    return Range(value, value, zone);
  } else if (IsMinusZero(value)) {
    return Type::MinusZero();
  } else if (std::isnan(value)) {
    return Type::NaN();
  }
Now what about our speculation nodes?
For those, they are handled by the OperationTyper. In our case, the arithmetic speculation for returning our value will call OperationTyper::SpeculativeSafeIntegerAdd which will set the type to a “safe integer” range, such as Int64. This type will be checked, and if it’s not an Int64 during execution, we deoptimize. This in essence allows for arithmetic operations to have positive and negative return value and it prevents potential over/underflow issues.
Knowing this, let’s take a look at the V8.TFTyper optimization phase to see the graph and the nodes associated types.

Range Analysis
During the Typer optimization the compiler traces through the code, identifies the range of operations and calculates the bounds of the resulting values. This is known as range analysis.
If you noticed in the graph above, we encountered the Range type, especially for the SpeculativeSafeIntegerAdd node which had the range of an Int64 variable. The reason this was done is because the range analysis optimizer computes the min and max of values that are added or returned.
In our case, we were returning the value of i from our object’s property of x plus 1. The type feedback only really knew that the value returned is an integer and that’s it, it never really could tell what range the value would be. So, to err on the safe side, it decided to give it the largest value possible in order to prevent issues.
So, let’s take another look at this range analysis by considering the following code:
function hot_function(obj) {
	let values = [0,13,1337]
	let a = 1;
	if (obj == "leet")
		a = 2;
	return values[a];
}
As we can see, depending on what type of obj parameter is passed in, if obj is a string that equals the word leet then a will equal 1337, otherwise it will equal 13. This part of the code will go through SSA and be merged into a Phi node that will contain the range of what a can be. The constants will have their range set to their hardcoded value, but these constants will also have an effect on our speculative ranges due to arithmetic computations.
If we were to look at the graph produced from this code after range analysis, we should see the following.

As you can see, due to SSA we have the Phi node. During range analysis the typer visits the TypePhi node function and creates a union of the operands 13 and 1337, allowing us to have the possible range for a.
For the speculative nodes, the OperationTyper calls the AddRanger function which computes the min and max bounds for the Range type. In this case you can see that the typer computes the range of our return values for both possible iteration of a after our arithmetic operations.
With this, in the case that the range analysis fails and we get a value not expected by the compiler, we deoptimize. Pretty simple to understand!
Bounds Checking Elimination (BCE)
Another common optimization that was applied with the Typer during the simplified lowering phase was the CheckBounds operation which is applied to CheckBound speculative nodes. This optimization is usually applied to array access operations if the index of the array has been proven to be within the bounds of the array after range analysis.
The reason I say “was” is due to the fact that the Chromium team has decided to disable this optimization in order to harden TurboFan’s bounds check against typer bugs. There are some “bugs” that will allow you to get around the hardening, but I won’t get into that. If you want to learn more about those bugs then I suggest reading “Circumventing Chrome’s Hardening of Typer Bugs”.
Either way, let’s demonstrate how this type of optimization would have worked by taking the following code for example:
function hot_function(obj) {
	let values = [0,13,1337]
	let a = 1;
	if (obj == "leet")
		a = 2;
	return values[a];
}
As you can see, this is pretty much similar to the code we used in our range analysis. We again accept a parameter to our hot_function and if the object matches a string of “leet” we set a to 2 and return the value of 1337, otherwise we set a to 1 and return the value of 13.
Particularly take note that a never equals 0, so we’ll never or at least should never be able to return 0. This creates an interesting case for us when we look at the graph. So, let’s look at the escape analysis portion of the IR and see how our graph looks like.
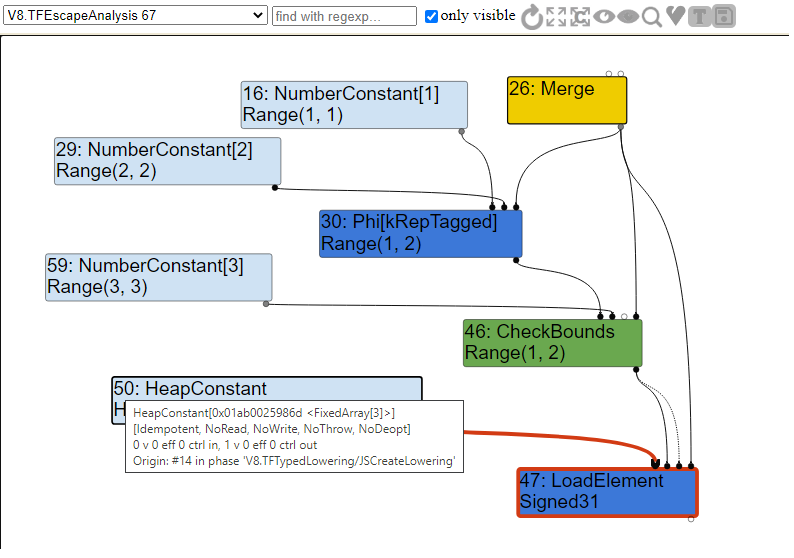
As you can see, we have another Phi node that merges our potential values of a and then we have our CheckBounds node which is used to check the bounds of the array. If we are in range of 1 or 2, we call LoadElement to load our element from the array, otherwise we will bailout since the bounds check is not expecting an index of 0.
For those that have noticed it already, you might be wondering why our LoadElement is of type Signed31 and not a Signed32. Simply, Signed31 represents the fact that the first bit is used to denote sign. This means that, in the case of a 32-bit signed integer, we are actually working with 31 value bits instead of 32. Also, as we can see the LoadElement has an input of a FixedArray HeapConstant with a length of 3. This array would be our values array.
Once escape analysis has been conducted, we move onto the simplified lowering phase. This lowering phase simply (pun intended) changes all value representations to the correct machine representation, as dictated by the machine operators themselves. The code for this phase is located within v8/src/compiler/simplified-lowering.cc. It is within this phase that bounds checking elimination is conducted.
So how does the compiler decide to make a CheckBounds node redundant?
Well, for each CheckBounds node the VisitCheckBounds function is going to be called. This function is responsible for checking and making sure that the index’s minimum range is equal to or greater than zero and that it’s maximum range does not exceed the array length. If the check is true, then it triggers a DeferReplacement which marks the node for removal.
An example of the VisitCheckBounds function before the hardening commit 7bb6dc0e06fa158df508bc8997f0fce4e33512a5 can be seen below.
  void VisitCheckBounds(Node* node, SimplifiedLowering* lowering) {
    CheckParameters const& p = CheckParametersOf(node->op());
    Type const index_type = TypeOf(node->InputAt(0));
    Type const length_type = TypeOf(node->InputAt(1));
    if (length_type.Is(Type::Unsigned31())) {
      if (index_type.Is(Type::Integral32OrMinusZero())) {
        // Map -0 to 0, and the values in the [-2^31,-1] range to the
        // [2^31,2^32-1] range, which will be considered out-of-bounds
        // as well, because the {length_type} is limited to Unsigned31.
        VisitBinop(node, UseInfo::TruncatingWord32(),
                   MachineRepresentation::kWord32);
        if (lower()) {
          if (lowering->poisoning_level_ ==
                  PoisoningMitigationLevel::kDontPoison &&
              (index_type.IsNone() || length_type.IsNone() ||
               (index_type.Min() >= 0.0 &&
                index_type.Max() < length_type.Min()))) {
            // The bounds check is redundant if we already know that
            // the index is within the bounds of [0.0, length[.
            DeferReplacement(node, node->InputAt(0)); // <= Removes Nodes
          } else {
            NodeProperties::ChangeOp(
                node, simplified()->CheckedUint32Bounds(p.feedback()));
          }
        }
      ...
  }
As you can see our CheckBound range would fall into the if statement, where Range(1,2).Min() >= 0 and Range(1,2).Max() < 3. In that case our node #46 from the above graph would be made redundant and removed.
Now, if you look at the updated code after the commit, you will see a slight change. The call to DeferReplacement has been removed and instead we replace the node with a CheckedUint32Bounds node. If the check fails, TurboFan calls kAbortOnOutOfBounds which aborts the bound check and crashes instead of deoptimizing.
The new code can be seen below:
  void VisitCheckBounds(Node* node, SimplifiedLowering* lowering) {
    CheckBoundsParameters const& p = CheckBoundsParametersOf(node->op());
    FeedbackSource const& feedback = p.check_parameters().feedback();
    Type const index_type = TypeOf(node->InputAt(0));
    Type const length_type = TypeOf(node->InputAt(1));

    // Conversions, if requested and needed, will be handled by the
    // representation changer, not by the lower-level Checked*Bounds operators.
    CheckBoundsFlags new_flags =
        p.flags().without(CheckBoundsFlag::kConvertStringAndMinusZero);

    if (length_type.Is(Type::Unsigned31())) {
      if (index_type.Is(Type::Integral32()) ||
          (index_type.Is(Type::Integral32OrMinusZero()) &&
           p.flags() & CheckBoundsFlag::kConvertStringAndMinusZero)) {
        // Map the values in the [-2^31,-1] range to the [2^31,2^32-1] range,
        // which will be considered out-of-bounds because the {length_type} is
        // limited to Unsigned31. This also converts -0 to 0.
        VisitBinop<T>(node, UseInfo::TruncatingWord32(),
                      MachineRepresentation::kWord32);
        if (lower<T>()) {
          if (index_type.IsNone() || length_type.IsNone() ||
              (index_type.Min() >= 0.0 &&
               index_type.Max() < length_type.Min())) {
            // The bounds check is redundant if we already know that
            // the index is within the bounds of [0.0, length[.
            // TODO(neis): Move this into TypedOptimization?
            new_flags |= CheckBoundsFlag::kAbortOnOutOfBounds; // <= Abort & Crash
          }
          ChangeOp(node,
                   simplified()->CheckedUint32Bounds(feedback, new_flags)); // <= Replace Node
        }
      ...
  }
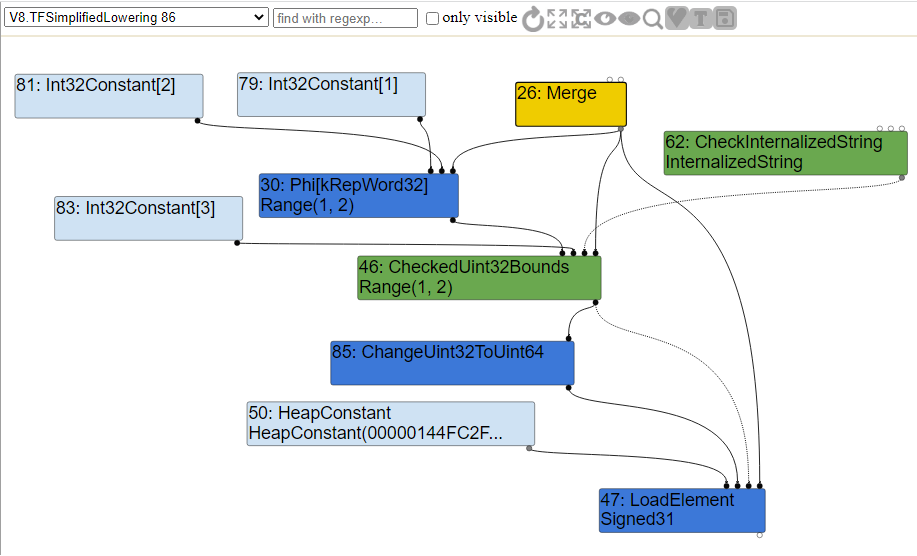
If we look at the simplified lowering portion of the graph, we can indeed see that the CheckBounds node has now been replaced with a CheckedUint32Bounds node as per the code and all other nodes had their values “lowered” to machine code representation.
Redundancy Elimination
Another popular class of optimizations that is similar to the BCE, is called redundancy elimination. The code for this is located within v8/src/compiler/redundancy-elimination.cc and is responsible for removing redundant type checks. The RedundancyElimination class is essentially a graph reducer that tries to either remove or combine redundant checks in the effect chain.
The effect chain is pretty much the order of operations between effect edges for load and store functions. For example, if we try to load a property from an object and try to add to it, such as obj[x] = obj[x] + 1 then our effect chain would be JSLoadNamed => SpeculativeSafeIntegerAdd => JSStoreNamed. TurboFan has to make sure that these nodes external effects aren’t reordered or otherwise we might have improper guards in place.
A reducer, as detailed in v8/src/compiler/graph-reducer.h, tries to simplify a given node based on its operator and inputs. There are few type of reducers such as constant folding, where if we add two constants with each other, we’ll fold them over to just one, i.e. 3 + 5 will now just be a single constant node of 8, and strength reduction where if a value is added to a node with no effects, we’ll keep a single node, i.e. x + 0 will just have the node x.
We can trace these types of reductions with the --trace_turbo_reduction flag. If we were to run our hot_function again from above with that flag, you should see output as such.
C:\dev\v8\v8\out\x64.debug>d8 --trace_turbo_reduction hot_function.js
- Replacement of #12: Parameter[-1, debug name: %closure](0) with #41: HeapConstant[0x00c800259781 <JSFunction hot_function (sfi = 000000C800259679)>] by reducer JSContextSpecialization
- Replacement of #34: JSLoadProperty[sloppy, FeedbackSource(#2)](14, 30, 5, 4, 35, 31, 26) with #47: LoadElement[tagged base, 8, Signed31, kRepTaggedSigned|kTypeInt32, FullWriteBarrier](44, 46, 46, 26) by reducer JSNativeContextSpecialization
- Replacement of #42: Checkpoint(33, 31, 26) with #31: Checkpoint(33, 21, 26) by reducer CheckpointElimination
- In-place update of #36: NumberConstant[0] by reducer Typer
... snip ...
- In-place update of #26: Merge(24, 27) by reducer BranchElimination
- In-place update of #43: CheckMaps[None, 0x00c80024dcb9 <Map[16](PACKED_SMI_ELEMENTS)>, FeedbackSource(INVALID)](61, 62, 26) by reducer RedundancyElimination
- Replacement of #43: CheckMaps[None, 0x00c80024dcb9 <Map[16](PACKED_SMI_ELEMENTS)>, FeedbackSource(INVALID)](61, 62, 26) with #62: CheckInternalizedString(2, 18, 8) by reducer LoadElimination
- In-place update of #44: LoadField[JSObjectElements, tagged base, 8, Internal, kRepTaggedPointer|kTypeAny, PointerWriteBarrier, mutable](61, 62, 26) by reducer RedundancyElimination
- Replacement of #44: LoadField[JSObjectElements, tagged base, 8, Internal, kRepTaggedPointer|kTypeAny, PointerWriteBarrier, mutable](61, 62, 26) with #50: HeapConstant[0x00c800259811 <FixedArray[3]>] by reducer LoadElimination
- In-place update of #45: LoadField[JSArrayLength, tagged base, 12, Range(0, 134217725), kRepTaggedSigned|kTypeInt32, NoWriteBarrier, mutable](61, 62, 26) by reducer RedundancyElimination
- Replacement of #45: LoadField[JSArrayLength, tagged base, 12, Range(0, 134217725), kRepTaggedSigned|kTypeInt32, NoWriteBarrier, mutable](61, 62, 26) with #59: NumberConstant[3] by reducer LoadElimination
... snip ...
There’s a lot of interesting output from that flag, and as you can see there is a lot of different reducers and eliminations that are executed. We’ll briefly cover a few of them later in this post, but I want you to look careful at a few of these reductions.
For example, this one:
In-place update of #43: CheckMaps[None, 0x00c80024dcb9 <Map[16](PACKED_SMI_ELEMENTS)>, FeedbackSource(INVALID)](61, 62, 26) by reducer RedundancyElimination
Yah, you read that correctly - CheckMaps was updated and later replaced due to the RedundancyElimination reducer. The reason this happened is because redundancy elimination detected that the CheckMaps call was a redundant check and removed all but the first one in the same control-flow path.
At this point I know what a few of you might be thinking, “Isn’t that a security vulnerability”? The answer to that is “potentially” and “it depends”.
Before I explain this in a bit more detail, let’s take a look at the following code example:
function hot_function(obj) {
	return obj.a + obj.b;
}
As you can see, this code is pretty simple. It takes in one object and returns the sum of the values from property a and property b. If we look into the Typer optimization graph, we will see the following.
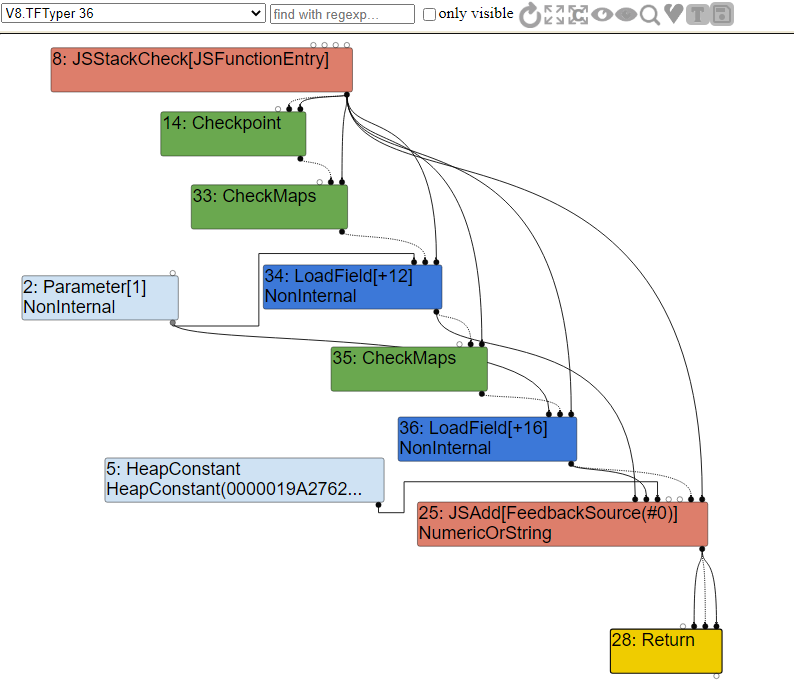
As you can see, when we enter our function, we first call CheckMaps to validate that the map of the object we are passing in corresponds to having both the a and b properties. If that check passes, we then call LoadField to load in offset 12 from the Parameter constant, which is the a property from the obj object that we passed in.
Right after that, we do another CheckMaps call to validate the map again, and then load property b. Once that’s done, we call the JSAdd function to either add numbers, strings, or both together.
The issue here is the redundant CheckMaps call, because as we know it, the map of this object that we are passing in can’t change between the two CheckMap operations. In that case, it will be removed.
We can see this redundancy elimination within the simplified lower phase of the graph.
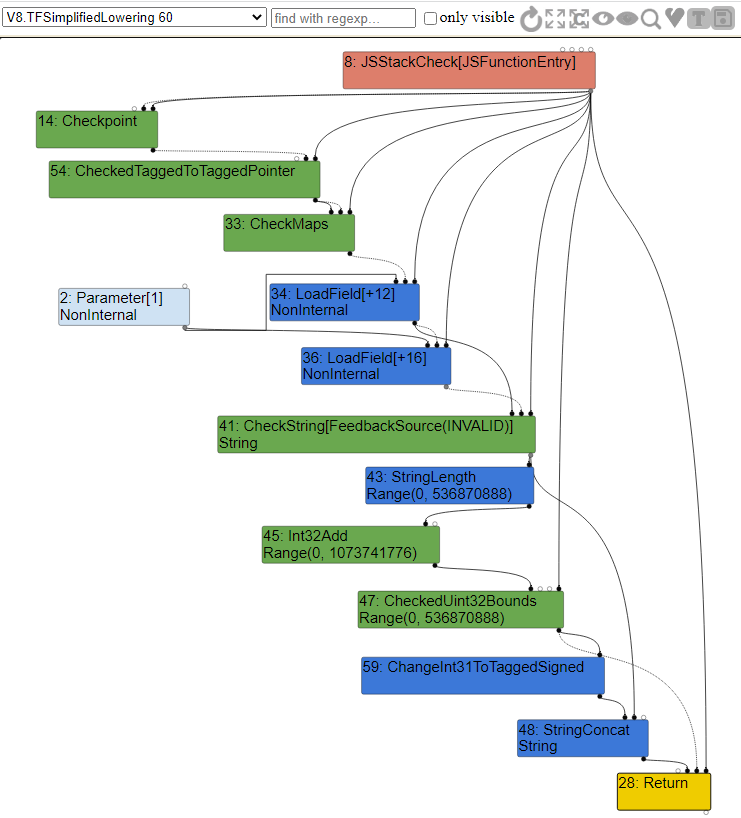
As you can clearly see, the second CheckMaps node has now been removed and after the first check we simply load both of the properties one after another - in essence speeding up our code. Also, due to simplified lowering the JSAdd call has been lowered down to the machine code variant to validate both integer and string expressions as per the ECMAScript standard.
So going back to our question on if this is a security vulnerability or not. As stated, “it depends”. The reason for this is that certain operation can cause side-effects to the observable execution of our context - that’s why we have side effect chains. If TurboFan for some reason forgot to take into account a side-effect and doesn’t write it to the side-effect chain, then it’s possible that the Map of the object can change during execution, such as another user function call modifying the object or adding a property.
Each intermediate representation operation in V8 has various flags associated with it. An example of a few of the flags for JavaScript operators can be seen in v8/src/compiler/js-operator.cc Some of these flags have specific assumptions around them.
For example, V(ToString, Operator::kNoProperties, 1, 1) assumes that a String should have no properties. Another one such as V(LoadMessage, Operator::kNoThrow | Operator::kNoWrite, 0, 1) assumes that the LoadMessage operation will not have observable side-effects via the kNoWrite flag. This kNoWrite flag does not actually write to the effect chain.
As you can see, if we can get the compiler to remove a redundancy check for an operation that seemingly thinks there are no side-effects, then you have a potentially exploitable bug if you can modify an object or property during the execution of the compiled code.
This topic on redundancy elimination and side-effects initially can be expanded on to discuss how bugs steming from these elimination checks can lead to exploitable vulnerabilities. But before we do that, let’s juts quickly brief over some other common optimizations.
Other Optimizations
As previously seen from the output of the --trace_turbo_reduction flag, there are a lot more optimizations that occur in TurboFan then what we talked about. I tried to cover the most important ones that are related to the bug we will be exploiting in Part 3, but I still want to quickly cover some of the other optimizations so at least you have a general gist of what they are.
Some of the other common optimizations you will see in TurboFan are as follows:
- Control Optimization: As defined in
v8/src/compiler/control-flow-optimizer.cc, generally this optimization works on optimizing the flow of the graph and turns certain branch chains into switches. - Alias Analysis & Global Value Numbering: Alias analysis identifies dependencies between
StoreandLoadnodes. So, if two load operations are dependent on one, they can’t be executed till the first operation is complete, i.e.x = 2; y = x + 2; z = x + 2. GVN or Global Value Numbering follows suite, and removes redundantStoreandLoadoperations, i.e.,z = x + 2can be removed andzcan be set toysince the operation is redundant. - Dead Code Elimination (DCE): Dead Code Elimination is exactly what it sounds like. It simply iterates through all the nodes and removes the code that won’t be executed. Such as if
xandyfor a True/False statement are always true, the false path will be considered “dead” and removed.
If you would like to learn more about the different optimizations and learn more about the Sea of Nodes I suggest reading “TurboFan JIT Design”, and “Introduction to TurboFan”.
Common JIT Compiler Vulnerabilities
With an understanding of the full V8 pipeline, and the compiler optimizations, we can now start looking at and understanding what type of vulnerability classes are present in browsers. As we know it, the JavaScript engine and all its components such as the compiler are all implemented in C++.
In that case the pipeline is first and foremost vulnerable to common memory and type safety violations, such as integer overflows and underflows, off-by-one errors, out-of-bound reads and writes, buffer overflows, heap overflows, and of course use-after-free bugs to name a few.
In addition to the usual C++ bugs, we also can have logic bugs and machine-code generation bugs that can occur during the optimization phase due to the nature of speculative assumptions. Such logic bugs can stem from the incorrect assumption of the potential side-effects an operation can have on an object or property or from improper optimization passes which remove critical type guards.
These types of issues are generally known as “type-confusion” vulnerabilities where the compiler doesn’t verify the type or shape of the object that is passed to it, resulting in the compiler blindly using the object. This was the case in CVE-2018-17463, which we will attempt to analyze and exploit in Part 3 of this blog.
At this point of the blog, I considered diving into analyzing a few bugs and showing you examples of vulnerable code. In the end, I decided not to do that. Why? Well, at this point of the series you should have a good enough understanding of browser internals and V8 to be able to look through Chromium code and understand certain bug reports on your own.
So, here’s some homework for you, the reader. I will provide you with a list of videos and bug reports relating around browser exploitation. Take the time to read through some of these reports, and understand how these bugs came to be, and what allowed them to be exploited.
Do note that some of these bugs are in other JavaScript engines, but regardless, they provide you a representation of the possible vulnerabilities that can stem in all JavaScript Engines.
I recommend reading the following:
- 35C3 - From Zero to Zero Day: ChakraCore Type Confusion due to Invalid Side-Effects
- Browser Security Beyond Sandboxing - CVE-2017-5121
- Chrome TurboFan Remote Code Execution via Type Confusion
- CVE-2015-0817 - Incorrect asm.js Bounds Checking Elimination
- CVE-2016-1669 - Use After Free in RegExp
- CVE-2016-1677 - Type Confusion Leads to Info Leak in decodeURI
- CVE-2016-5129 - V8 Out of Bound Read in GC with Array Object
- CVE-2017-2547 - WebKit: Invalid Bounds Check leads to OOB Access
- CVE-2017-5040 - Information Leak in Array indexOf
- CVE-2018-0758 - Chakra: JIT: Missing Integer Overflow Check
- CVE-2018-0769 - Chakra JIT: Incorrect Bounds Calculation
- CVE-2018-4192 - Race Condition in Garbage Collection for array.reverse()
- CVE-2018-6065 - V8 Integer Overflow in Object Allocation Size
- CVE-2018-6106 - V8 AwaitedPromise Incorrect State
- CVE-2018-6136 - Crash with JavaScript RegExp Subclassing
- CVE-2018-6142 - Information Leak in Map Constructor
- CVE-2019-5782 - Improper Side-Effect in Lowering Leads to OOB via Check Bounds Elimination
- CVE-2019-13764 - Invalid NaN Type Check via Typer Optimizer
- CVE-2021-21220 - Improper JIT OpCode Leads to RCE
- Exploiting Chrome V8: Krautflare (35C3 CTF 2018)
- Exploiting TurboFan Through Bound Check Elimination
- Issue: 762847 - Off By One in Range Optimization of String.indexOf
- Patch Gapping Chrome - Properties Backing Store Type Confusion
- JavaScript Vulnerability Database
- ZDI Advisories Page
Closing
Well that about does it for this post! Thanks for sticking around to the end and reading though all of this, as there was a lot of complex material that was covered. I can’t even count the number of times I had to go back and edit this initial draft of the blog post while learning all of this myself.
Hopefully a lot of the material that was presented here was easily understandable. And if it wasn’t, then again just as with my first post - take the time to read through this and utilize the links within the blog and references section to help you understand some of the concepts that are unclear.
Honestly, what helped me learn the most was reading through and debugging the V8 code. This gives you a much better idea of what happens under the hood and what is called where and when. This also helps you get more familiarized with the code if you’re trying to review it for bugs.
Anyway, with all the information that we covered here, the optimizations portion will be the most important for us in the next post. In part three of this blog post series, we’ll take everything we know to analyze and understand CVE-2018-17463. Afterwards, we’ll jump into understanding the basics around browser exploitation primitives, and then we’ll go through and actually exploit the bug to get remote code execution on the system.
With that being said, thanks for reading and I’ll see you in the next post!
Kudos
I would like to sincerely thank maxpl0it for doing a thorough technical review of this blog post, for providing critical feedback and adding in a few important details before it’s release.
I also want to thank Connor McGarr and V3ded for taking the time to proofread this post for accuracy and readability. Thank you for your time guys!
Finally, I want to give a shout out to Jeremy Fetiveau for his amazing work in the Chrome exploitation space, and for writing such detailed blog posts for Diary of a Reverse Engineer. These posts were immensely helpful in understanding a lot of the nuances in Chrome and V8.
References
- An Introduction to Speculative Optimization in V8
- Circumventing Chrome’s Hardening of Typer Bugs
- Compiler Design: Static Single Assignment
- Deoptimization in V8
- Digging into the TurboFan JIT
- Exploiting TurboFan Through Bounds Check Elimination
- Firing up the Ignition interpreter
- Franziska Hinkelmann: JavaScript engines - how do they even?
- Getting Around the Chromium Source Code Directory Structure
- How To Start JIT-ting
- Ignition and TurboFan Compiler Pipeline
- Ignition Design Docs
- Ignition: Register Equivalence Optimization
- Intro to Chrome’s V8 from an Exploit Development Angle
- Introduction to TurboFan
- JavaScript engine fundamentals: optimizing prototypes
- JavaScript Engine Fundamentals: Shapes and Inline Caches
- Modern attacks on the Chrome browser : optimizations and deoptimizations
- Sea of Nodes
- Sigurd Scheider: Inside V8: The choreography of Ignition and TurboFan
- Sparkplug Design Documentation
- The Chromium Super (Inline Cache) Type Confusion
- TurboFan IR
- TurboFan JIT Design
- Understanding V8’s Bytecode
- V8 and How It Listens To You - Michael Stanton
- V8 release v6.8
- V8: Hooking up the Ignition to the TurboFan
- What’s up with Monomorphism?
Leave a Comment